Urban Pain Index: when 10 complaints on one street may matter more than 30 across a neighborhood
The Urban Pain Index, born from a question about spatial concentration: the Pinheiral Digital context, Haversine distance, reproducible simulations, validation and an open methodology.
Voices depend on your browser and device; some require internet access. Code blocks are not read aloud.
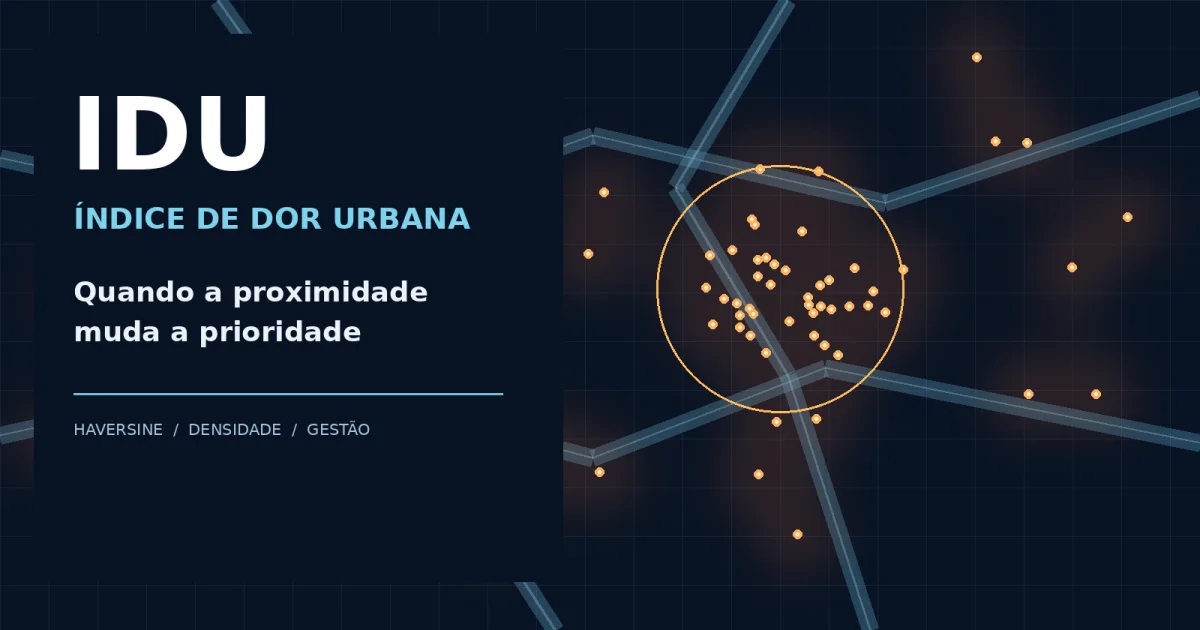
Urban Pain Index: when ten complaints on one street may outweigh thirty across a neighborhood
An open spatial methodology for public-service prioritization, rooted in the Pinheiral Digital experience in Brazil.
Can ten complaints concentrated on one street matter more than thirty scattered across an entire neighborhood?
That question motivated the Urban Pain Index (IDU, its Portuguese acronym). The answer is conditional: geography matters, but so do severity, the people exposed, issue type and operational capacity.
Where the idea came from
The IDU emerged from work on modernizing local government in Pinheiral, Rio de Janeiro state, Brazil, alongside Pinheiral Digital, a civic system that organizes residents' urban-service reports. By February 2026, records already describe its use in reporting and discussion; the exact date when the original formula was conceived has not been independently established here.
The operational environment supports reports by neighborhood, thematic axis, responsible department, period and municipality. The IDU-related analytics also featured in the municipality's Sebrae Entrepreneurial Mayor Award experience. This contextualizes the initiative, but does not constitute scientific validation of the formula.
Raw counts by administrative boundary are informative but can hide intense localized problems. A street with recurring flooding may need a focused response, while thirty distinct reports elsewhere in a neighborhood may require many unrelated interventions.
Haversine as the geographical building block
With two latitude–longitude pairs, the Haversine formula estimates great-circle distance:
a = sin²((φ₂−φ₁)/2) + cos(φ₁)cos(φ₂)sin²((λ₂−λ₁)/2)
d = 2R atan2(√a, √(1−a))
Here, φ denotes latitude, λ longitude (in radians), and R is Earth's mean radius (roughly 6,371 km). This enables fixed-radius neighborhood queries independent of neighborhood boundaries. Haversine is not the index itself; it supports spatial concentration measurement. Road-network distance may be preferable for actual travel or accessibility analysis.
An explicit, reproducible model
For a fixed radius r, local density is:
D_r(x) = N_r(x)/(πr²)
N_r(x) is the number of reports within distance r from location x. For direct comparisons, keep the radius and time window fixed.
An illustrative methodological formalization—not a claim about audited production code—is:
IDU_r(x,t) = [A_ref/(πr²)] × Σ(g_i × p_i × u_i × q_i)
for events i within r of x in time window t
Terms g, p, u and q represent publicly defined severity, issue weight, urgency and temporal/repetition factors, respectively; A_ref is a common reference area. Scale normalization, weight governance and deduplication are essential. Earlier design discussions also considered a 0–10 weighted index using volume, severity, urgency, recurrence and concentration. The exact formula deployed in production was not audited for this publication.
A numerical simulation—not municipal findings
| Measure | Area A: neighborhood | Area B: micro-area |
|---|---|---|
| Reports | 30 | 10 |
| Observed area | 3 km² | π(0.04 km)² ≈ 0.005027 km² |
| Density | 10/km² | 1,989.4/km² |
| Density ratio | 1× | ≈198.9× |
This extreme ratio mainly reflects different observation scales. It is not evidence that the second area deserves 199 times the resources. Fair spatial comparisons must use common radius windows and account for exposure. With the same 50 m radius, ten reports in one window versus two in another represent a fivefold local-density difference, not a complete judgment about all thirty reports in the wider neighborhood.
Research design and statistical validation
The falsifiable question is whether spatial concentration adds predictive or decision value beyond counts, severity and population exposure. Define an independent outcome, such as expert-assessed hazard or documented unresolved infrastructure failure. Compare a baseline model (counts, issue types, exposure), a spatial model (baseline plus fixed-radius density) and an extended model (severity, recurrence and vulnerability). Choose regression families based on outcome structure; inspect residual spatial autocorrelation using Moran's I, evaluate local patterns with LISA, and compare explorations using DBSCAN and kernel density estimation.
Use temporal and ideally spatial holdouts, sensitivity checks for multiple radii, calibration and uncertainty reporting. A mathematically produced index is not statistically validated merely because its coefficients are significant.
Reporting systems contain selection bias: digital access, awareness, duplicated reports and differential participation can create participation hotspots, not necessarily damage hotspots. Field inspection and emergency criteria remain indispensable.
Where it has been used—and what remains unproven
Pinheiral Digital provides the real operational setting for georeferenced requests and dashboards that motivated the IDU. This publication sets out an open proposal for its mathematical specification, not an external audit of the deployed implementation, a public benchmark dataset or evidence of causal impact. The distinction is intentional.
The approach is stack-independent: SQL/PostGIS, Python, PHP or other tools can implement the same definitions. Municipal replication needs versioned parameters, synthetic test data, duplicate handling, secure coordinate handling, source control and accessible documentation.
Open-IDU manifesto
- Publish formulas, parameter definitions and model changes.
- Provide runnable examples and synthetic datasets.
- Favor interoperable formats and vendor independence.
- Document uncertainty, bias and validation limits.
- Protect residents: no publicly exposed household coordinates or identifiable complaint narratives.
- Invite independent studies before claiming universal efficacy.
- Keep professional judgment and residents' rights ahead of automatic scoring.
An open methodology does not imply that municipal operational datasets or current source code are already released under open licenses. Any source release requires license choice, privacy review and a documented contribution process.
Conclusion
Ten spatially concentrated complaints can reveal a priority that thirty dispersed records conceal—but only further evidence can determine which deserves action first. The IDU's contribution is a transparent, testable way to pose the question. Public-sector modernization should make urban problems easier to see without reducing people to a score.
Academic references
- TOBLER, W. R. (1970). A Computer Movie Simulating Urban Growth in the Detroit Region. Economic Geography, 46, 234–240. https://doi.org/10.2307/143141
- ANSELIN, L. (1995). Local Indicators of Spatial Association—LISA. Geographical Analysis, 27(2), 93–115. https://doi.org/10.1111/j.1538-4632.1995.tb00338.x
- ESTER, M. et al. (1996). A Density-Based Algorithm for Discovering Clusters in Large Spatial Databases with Noise. KDD-96. https://file.biolab.si/papers/1996-DBSCAN-KDD.pdf
- SILVERMAN, B. W. (1986). Density Estimation for Statistics and Data Analysis. https://doi.org/10.1007/978-1-4899-3324-9
Method note: numerical examples are synthetic; no field performance estimate is claimed.